Overview
On June 23, 2026, a convective system moved through the Dallas, Texas area, impacting the vicinity of Dallas Love Field. Meteorological analysis indicates the presence of a high-reflectivity storm core with sustained rotational signatures, though no tornado touchdowns were confirmed by post-event surveys.
Environmental Context
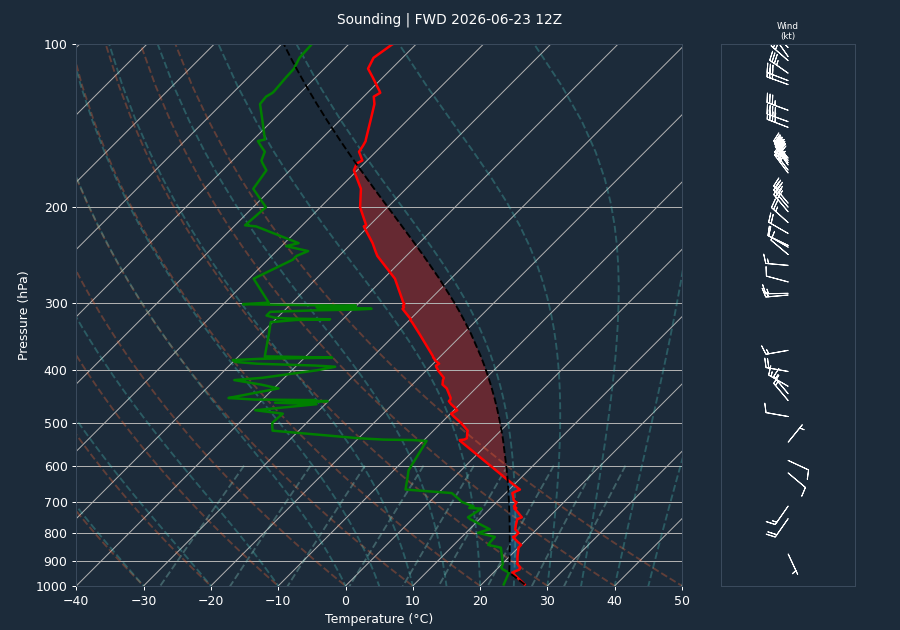
The pre-event environment was characterized by moderate instability, with a sounding taken at 12:00 UTC showing a CAPE value of 2332 J/kg and a CIN of -64 J/kg, suggesting an atmosphere capable of supporting organized convection despite some capping. The 0-6km bulk shear was measured at 15 knots, which is generally considered low for sustained supercellular development.
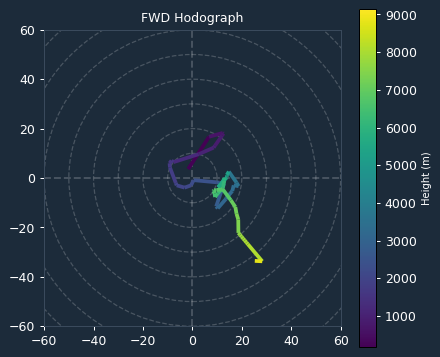
Kinematic data derived from the VAD wind profile during the event provided a more current look at the storm-time environment. The 0-1km Storm Relative Helicity (SRH) was 33 m²/s², and the 0-3km SRH was 27 m²/s². These low SRH values indicate a limited environment for significant mesocyclone development or sustained tornadic rotation, consistent with the lack of observed tornadic activity.
Storm Evolution
Radar data from KFWS tracked the storm's progression between 23:03 UTC and 23:59 UTC. The storm exhibited a consistent high-reflectivity core, with maximum reflectivity values frequently exceeding 60 dBZ. A notable trend occurred at 23:35 UTC, when the maximum reflectivity spiked to 67 dBZ while the height of the maximum reflectivity core descended to 10.6 kft AGL, indicating a significant core descent. Throughout the period, echo tops remained elevated, generally hovering between 61 kft and 64 kft, which suggests a robust updraft. Velocity data showed consistent inbound and outbound signatures; however, it should be noted that velocities reached the radar's effective measurement limit (Nyquist) during several scans, preventing the identification of higher wind speeds.
Warnings Issued
There were no official weather warnings issued for this event. Consequently, there is no lead time data to evaluate regarding warning effectiveness.
Impacts
Post-event surveys and NCEI records confirm that there were no tornadoes, fatalities, or injuries associated with this event. No property damage estimates are available, and no local storm reports were filed for the Dallas Love Field area or the surrounding Dallas County region.
Conclusion
The convective event on June 23, 2026, produced strong reflectivity cores and sustained updrafts as observed by radar. However, the lack of significant low-level shear, as evidenced by the low SRH values, likely inhibited the development of tornadic rotation. The event concluded without any reported impacts or damage.